The bus passenger flow statistics system can provide scientific and effective data support for route planning, operation scheduling, ticket management, etc. of the bus management system, thereby improving the economic benefits of the bus operating company, improving the service quality of public transportation, and improving passenger satisfaction.
Operational requirements
1. The passenger flow gathering and dispersing times and passenger flow stations are irregular, making it inconvenient to dynamically grasp
2. Lack of bus line network planning and data support
3. There is no objective evidence or basis for bus fare reimbursement.
4. Empty and crowded vehicles are becoming more and more frequent
5. Lack of reasonable and efficient command and deployment of line vehicles
6. Planned shifts rely solely on experience and work assignments are not based on contracts.
System principle
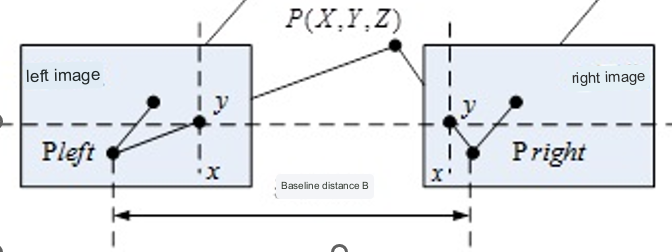
1. Build a model
The core of the system is the binocular camera above the car door. The camera is designed based on the principle of parallax. Just like the left eye and the right eye, the distance from the camera to point P is calculated through the principle of binocular parallax. Finally, a model of the human body is restored through this distance. Determine passenger flow and count passenger data by accurately identifying human bodies.
2. Algorithm identification This 3D model covers 3D features such as body contours, clothes, shape, height and other features. Through pattern recognition and module matching, the system creates an ID for each passenger and matches it with each station to generate passenger flow OD data.
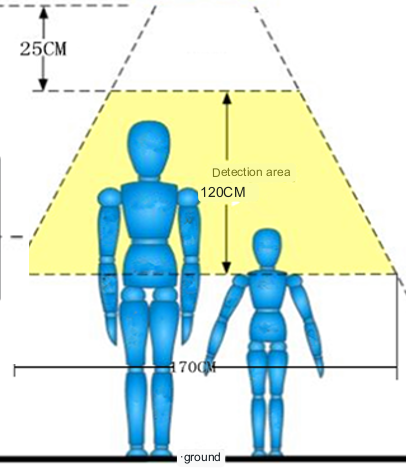
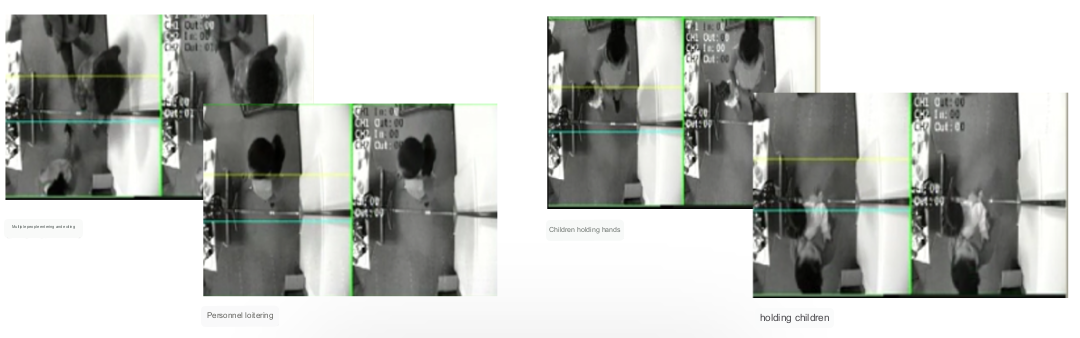
3. Through motion trajectory tracking, the system can identify multiple people entering and exiting at the same time, people wandering, and shaking. At the same time, it can determine the passenger height and distinguish between children and adults (lead and carry children on the bus)
Terminals:

The statistical terminal can upload the passenger flow data to the management terminal and platform after the front-end equipment (binocular camera) accurately collects the 3D model, while also taking into account
•Passenger flow data analysis
•4G/5G information transmission
•Real-time viewing of in-car video recordings
•In-car video history playback
•GPS positioning
•Track playback
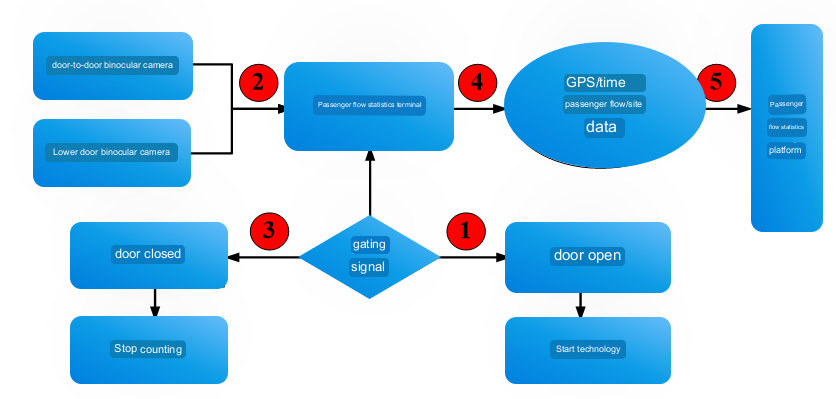
system structure
①The vehicle arrives at the station, the door opens, and the system detects the door opening signal
②The system collects passenger models through the entry and exit door collection equipment and identifies, analyzes and counts them through the passenger flow statistics equipment.
③When the door is closed, stop counting
④ Combine current time information, site information and other data for summary and association
⑤Upload the passenger flow information on and off the station to the central platform
Passenger flow data analysis:
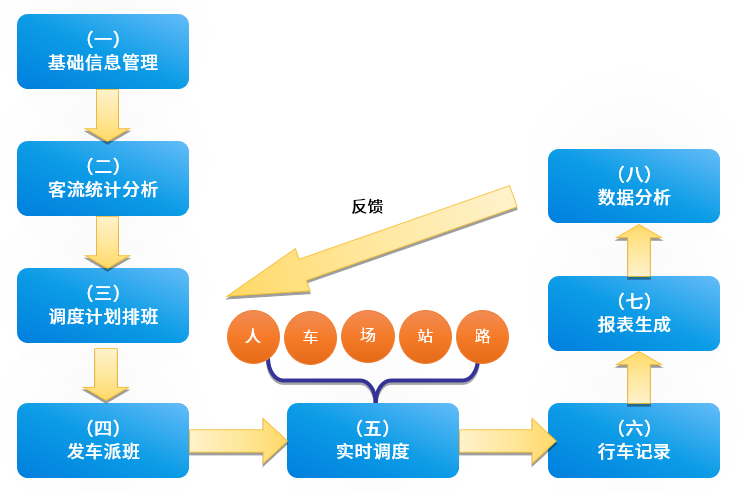
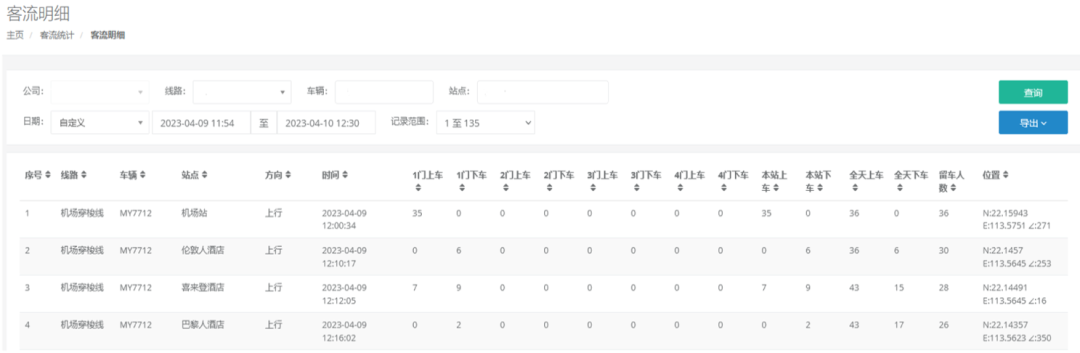
Through hot stop passenger flow data, OD data can know which lines, which time periods, and which stations have more hot stop, and more lines and vehicles can be added. Scientific allocation of resources: Using passenger flow data and OD data as one of the basis, more scientific route planning, site planning, trip plan planning, trip planning, etc. can be carried out to improve the efficiency of bus transportation capacity. Passenger flow record: Summarize the historical passenger flow, summarize and compare the optimized passenger flow, and then carry out new optimization. At the same time, historical passenger flow data can also be used as one of the basis for operational supervision. Real-time scheduling: Through real-time passenger flow data, real-time seat adjustment, seat adjustment optimization and emergency seat adjustment can be carried out Show results Real-time passenger flow statistics --The vehicle-mounted equipment counts passenger flow data in real time and uploads it to the center in real time. It can directly display the passenger flow data of vehicles on designated lines, which can include data such as route, up and down, time, station, number of people getting on and off, total number of people getting on and off, current number of people on the bus, etc.
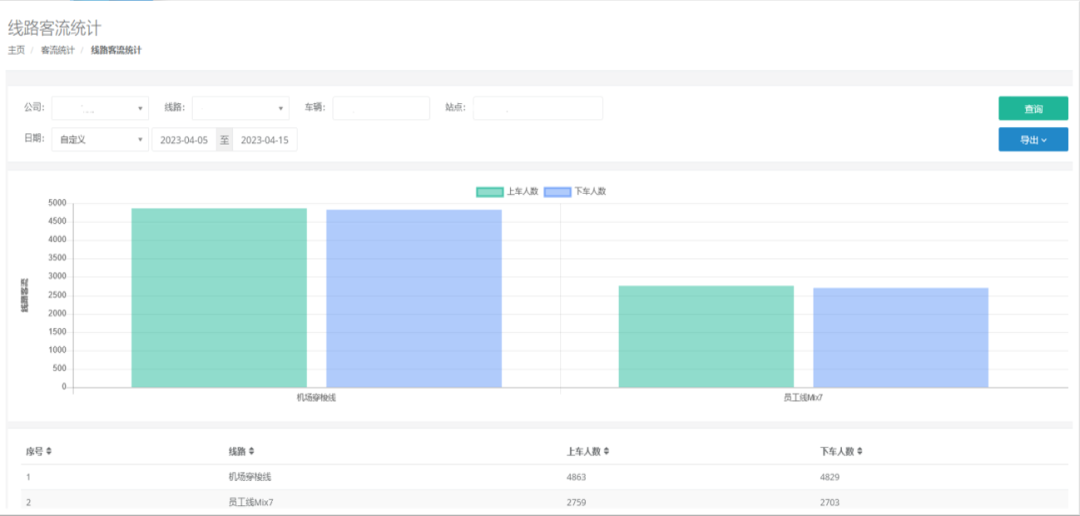
Passenger flow route distribution
--The real-time line passenger flow, historical line passenger flow, etc. can be summarized according to the set time, and the number of people getting on and off the designated line can be visually displayed through a bar chart.
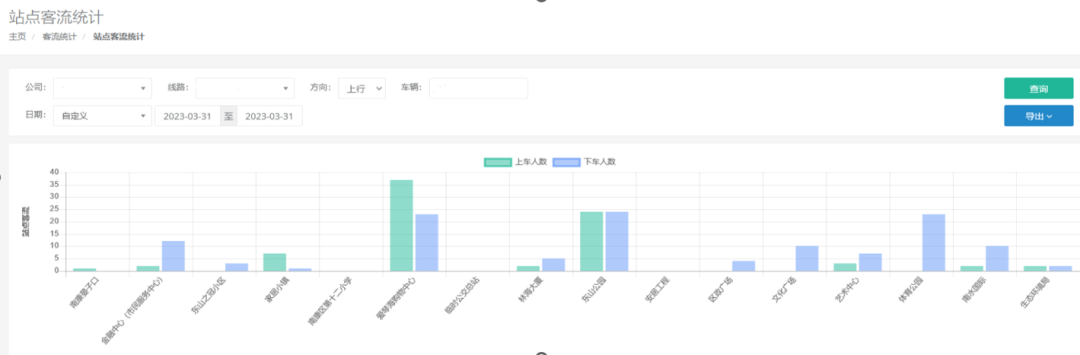
Distribution of passenger flow stations
--The station passenger flow, historical station passenger flow, etc. can be summarized according to the set time, and the number of people getting on and off the bus at each station on the entire line can be visually displayed through a bar chart.
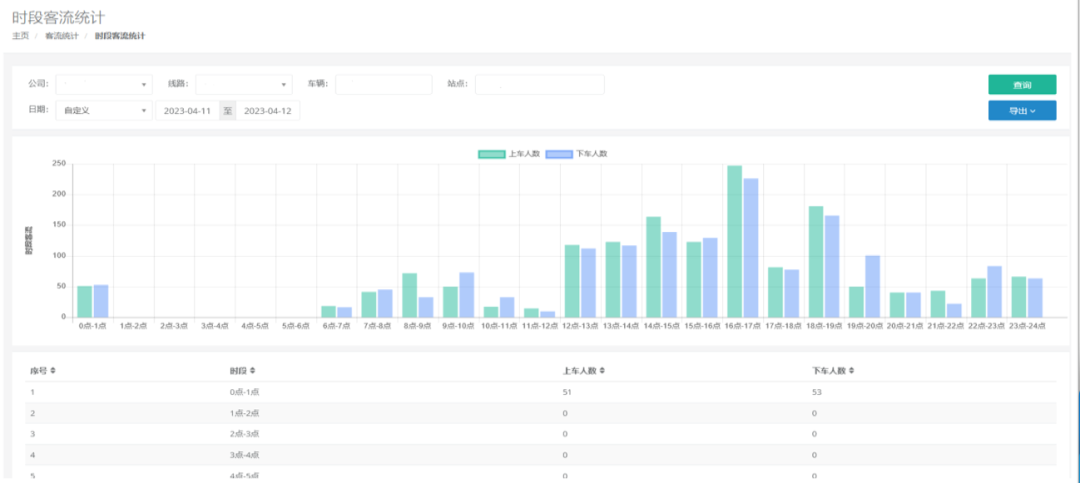
Distribution of passenger flow in time periods
--Intuitively understand the distribution of passenger flow in different periods of time within the line. You can summarize today's passenger flow, or you can customize the summary of historical passenger flow.
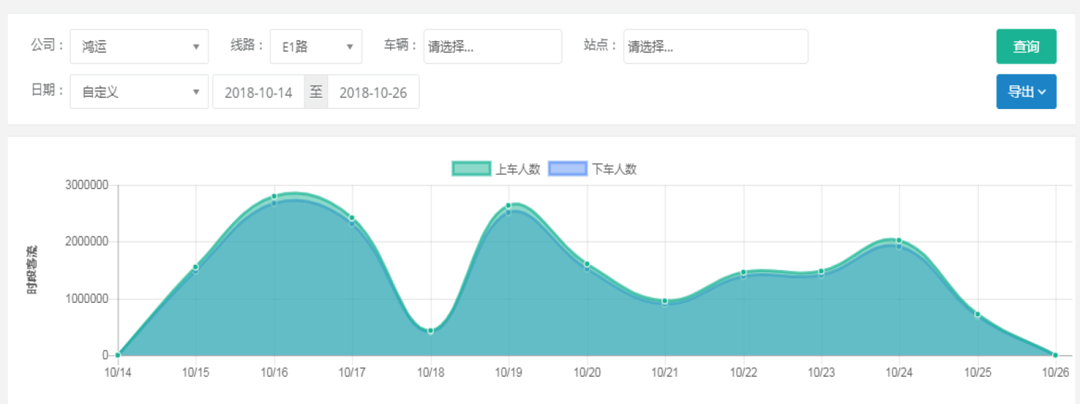
Passenger flow trend chart
--Intuitively understand the big data of line vehicles
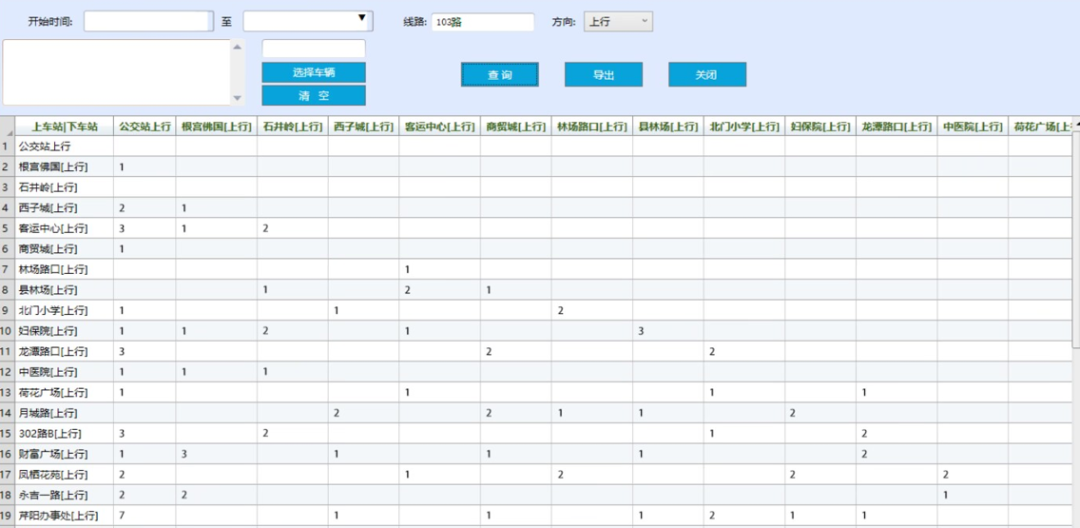
OD passenger flow summary
--Can summarize OD passenger flow data to show how many people got on the bus at site A and got off at site B.